Is an inverted yield curve still a reliable predictor of an impending recession? And will the recent flattening yield curve affect bank credit quality? Currently, with the narrowest spread between the 2-Year U.S. Treasury bill and the 10-Year U.S. Treasury note since the 2007 recession, both those questions are on the minds of treasury professionals responsible for monitoring and managing risk.
When short-term rates exceed long-term rates, they create an inverted yield curve, which is often taken as a signal that investors are more optimistic about short-term prospects versus the long term. Suggesting a lack of confidence in continued economic growth, an inverted yield curve is often seen as an early warning sign of a coming recession. However, the current economic cycle may be an exception to the rule. Factors including the historic interventions in money markets by central banks in the U.S. and Europe following the last recession have created a new set of dynamics that may make it harder to predict the impact of interest rates on future growth and profitability.
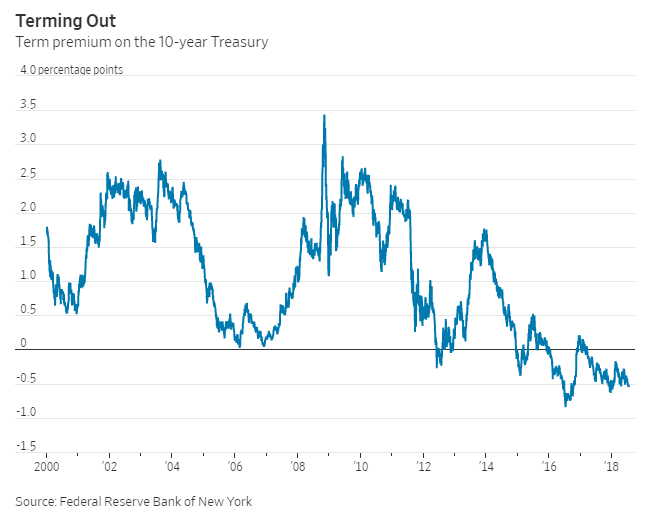
Normally, long-term interest rates are higher than short-term interest rates, in part because of the term premium. The term premium is derived from investors’ demand for greater compensation in exchange for the uncertainty associated with longer-term investments.
Graph 1: Term Premium on the 10-Year Treasury
Source: Justin Lahart, What the Fed Is Missing, Again, The Wall Street Journal
Graph 1 demonstrates the fluctuations in the term premium on the 10-year Treasury from 2000 to 2018. Some believe that the decline in term premia is a result of the Fed purchasing Treasuries. According to the New York Federal Reserve, if the term premium was at the level it has been at for the last 25 years, the 10-year Treasury yield would be 1.4% higher than the 2-year yield.
The Yield Curve as a Recession Indicator
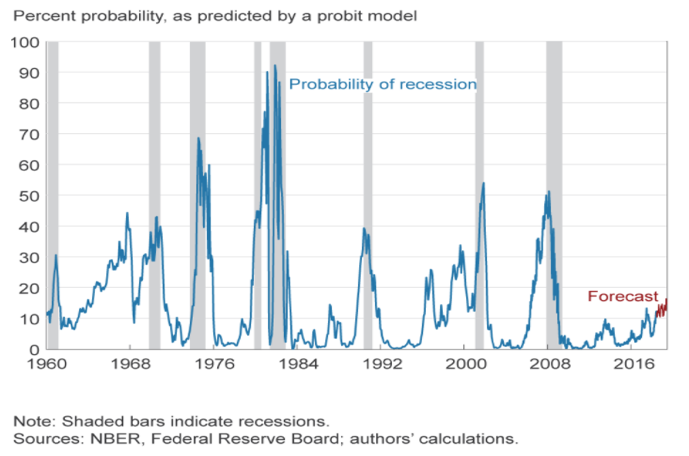
There are many conflicting opinions on the reliability of a yield-curve inversion as an indicator of a coming recession. According to one study done by the San Francisco Fed, an inverted yield curve has preceded all nine recessions that have occurred since 1955. Additionally, according to historical evidence around times of yield-curve inversions, an inverted yield curve is a far-leading indicator. In each case of an inverted yield curve prior to a recession, the recession occurred in the following 6 to 24 months. However, others believe that a yield-curve inversion is no longer a valid indicator of recessions because of actions taken by the Fed following the financial crisis. Mass bond purchases artificially depressed interest rates, until the Fed began to carry out tightening monetary policy in 2015. Graph 2 below, generated by the Federal Reserve Bank of Cleveland, demonstrates that though the likelihood of a recession has increased, it is still significantly below probability levels at the time of previous recessions. Because the current economic environment has not been seen before, an inverted yield curve may not necessarily be a reliable predictor of a recession.
Graph 2: Percentage Probability of a Recession
Source: Federal Reserve Bank of Cleveland, Yield Curve and Predicted GDP Growth, July 2018, Published 7/30/2018
The Effects of a Flattening Yield Curve on Bank Credit Quality
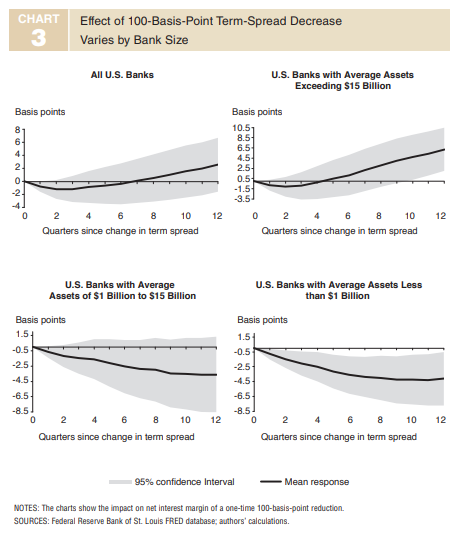
A narrowing spread on the yield curve and the possibility of an inversion also impacts bank profitability. As banks pay short-term rates on deposits and take in long-term rates on loans, steeper yield curves tend to positively impact banks’ profitability levels. A flat or inverted yield curve, therefore, could lead to negative net interest margins. The Dallas Fed analyzed how interest rates affect profitability levels of banks of different sizes and found that banks with lower average earnings assets (less than $1 billion) reported higher profitability levels stemming from interest-sensitive activity than banks with higher average earnings assets (greater than $15 billion).
Figure 1 below demonstrates that while on aggregate, U.S. bank net interest margin levels are negatively impacted by a narrowing yield curve in the short term, the banks that drive that negative trend tend to be smaller. The primary reason is that smaller banks often have less diversified franchises and rely more heavily on interest income than larger banks. Therefore, while a narrowing yield curve will have a negative impact on the net interest margins of banks of all sizes, the impact will be felt more strongly by small banks, while the impact on big banks will be less pronounced.
Figure 1: Effect of 100 Basis Point Spread Decrease Varied by Bank Size
Source: Federal Reserve Bank of Dallas, Smaller Banks Less Able to Withstand Flattening Yield Curve, Vol. 13, No. 8, June 2018
The Effect of Negative Interest Rates on Scandinavian Banks
Since 2012, four European central banks lowered nominal interest rates to negative interest rates. The IMF and the ECB conducted studies as recently as August of 2017 analyzing the effects of negative interest rates on bank profitability in Sweden and Denmark. Reports show that net interest margin levels in both countries remain for the most part in line with average levels prior to the implementation of negative interest rates. The IMF and ECB reports also demonstrated that consistent net interest margins were supported by increased lending and decreases in interest expenses.
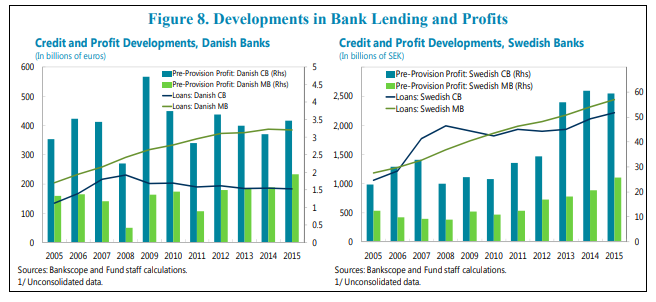
Figure 2 below shows that profit in Danish commercial banks and Danish mortgage banks increased from 2014 to 2015. Loans from Danish commercial banks declined slightly since 2008 reflecting remaining debt from the financial crisis. Loans from Danish mortgage banks continued to increase steadily. Additionally, profit at Swedish mortgage banks increased from 2010 to 2015, and though profit from commercial banks decreased slightly, it still came in at record highs. Loans from Swedish commercial banks increased since 2012 and loans from mortgage banks increased consistently since 2005. Despite a three-year-long negative interest rate environment in both Denmark and Sweden, banks have improved profitability levels and maintained net interest margins. The performance of banks in Sweden and Denmark suggests that U.S. banks may continue to maintain profit and net interest margin levels despite the narrowing yield curve term spreads.
Figure 2: Bank Lending and Profits in Sweden and Denmark
Source: Rima A. Turk, Negative Interest Rates: How Big a Challenge for Large Danish and Swedish Banks?, International Monetary Fund
Impact of Banking Industry Consolidation
One final consideration impacting net interest margin levels is the concentration of the US banking industry. In a more concentrated industry, banks may be able to maintain margins by passing on costs and because consumers will not have many alternatives. At the end of Q3 2017, the five largest US banks’ deposit base averaged $5.3 trillion, representing a share greater than 40% of the total U.S. deposit market of $13.2 trillion. Meanwhile, the three largest Danish banks account for 50% of the total assets of all Danish banks, and the four largest Swedish banks account for more than 80% of the total assets of all Swedish banks. Comparatively speaking, the US banking industry is slightly less concentrated than Swedish and Danish banking industries. While US banks’ net interest margins may not be significantly impacted, this is still an important factor to consider while monitoring the effect of flattening yield curve on bank credit quality.

 Source: Board of Governors of the Federal Reserve,
 Source: Bloomberg, as of 3/29/2017
 Source: Bloomberg, as of 3/29/2017