
Revisiting Bank Deposits as a Liquidity Solution
Abstract
Treasury organizations maintain deposit relationships despite uninsured credit risk and lost yield opportunity. Earnings credit rates may become less competitive than market-based rates. Including separate accounts in the mix helps address both credit and yield objectives in institutional liquidity management.
Introduction
The search for liquidity management solutions reached a new level of significance when institutional prime money market funds were required to float net asset values (NAVs) last fall. While treasury organizations may consider bank deposits as a fallback liquidity solution, regulatory changes, interest rate dynamics and other external factors demand a refresher course.
In our previous whitepapers, we discussed the transformation of corporate deposits as liquidity vehicles and reduced appetite of large systemically important banks (SIBs) for overnight deposits. Banks do not appear to have benefitted from the recent money market fund (MMF) reform through deposit inflows. Instead, asset declines in prime funds were met with almost identical increases in government fund assets.
Still, treasury organizations generally maintain deposit relationships, often with multiple banks, for liquidity, savings, escrow, trade, business relationships or other reasons. Institutional deposits tend to be greater than $250,000, and not protected by the FDIC deposit insurance. Some are placed with US branches of foreign banks under different sets of banking rules than those of the US financial authorities.
In this update, we review recent deposit growth among institutional liquidity accounts, issues surrounding the earnings credit rate (ECR), and the lagging yield effect of deposits in a rising interest rate environment.
Deposits Held Steady Since 2012
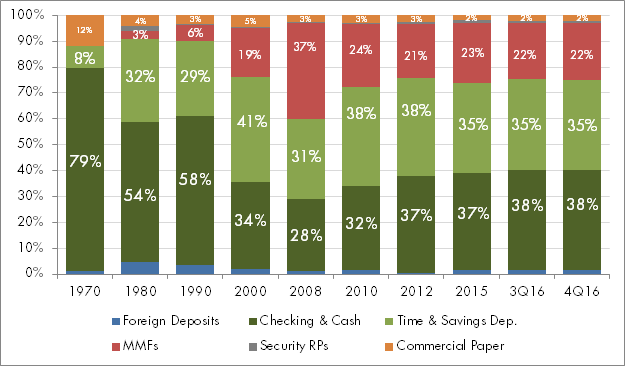
For as long as the history of modern banking, bank accounts were the primary, and often only, liquidity tool for businesses and other institutional entities. This reliance started to change with the introduction of money market mutual funds in the 1970s. The Federal Reserve’s Flow of Funds reports (Figure 1) show that 79% of the liquid balances at non-financial firms in the United States were in checking accounts or cash in 1970, with another 8% in time and savings deposits. Commercial paper investments (12%) made up the rest.
Figure 1: Liquid Balances at Non-Financial Firms

Source: Federal Reserve Board, Financial assets of the United States 1970-2016, L102
The popularity of MMFs in the next four decades resulted in a substantial reduction of deposits in corporate liquidity balances. By 2008, the year an institutional prime fund broke the constant dollar, MMFs made up 37% of the liquidity balances, while combined checking and savings deposits were reduced to 59%.
The FDIC’s Transaction Account Guarantees (TAG) program, effective October 14, 2008, and the Dodd-Frank Act provided unlimited deposit guarantees on all noninterest bearing transaction accounts through December 2012. Checking deposit representation expanded from 28% to 37% between 2008 and 2012, while savings also grew from 31% to 38%.
Despite TAG’s expiration and well publicized campaigns by large SIBs to turn away non-operating deposits to comply with federal liquidity regulations, deposits as a percentage of corporate liquid balances held steady through 2016. Checking and savings accounts represented 38% and 35%, respectively, of such balances.
Deposits did not decline after 2012 partly due to the lack of alternative liquidity options in the near zero interest rate environment. The anticipated floating NAV MMFs in 2016 was another factor. Figure 1 also shows that the distribution of checking, savings and MMF balances remained the same from the third to the fourth quarter of 2016, during which the MMF reform took effect. This suggests that the floating NAV requirement on prime funds did not drive MMF investors to deposits, but rather led to the reshuffling from prime to government funds.
DOWNLOAD FULL REPORT
Our research is for personal, non-commercial use only. You may not copy, distribute or modify content contained on this Website without prior written authorization from Capital Advisors Group. By viewing this Website and/or downloading its content, you agree to the Terms of Use.
Please click here for disclosure information: Our research is for personal, non-commercial use only. You may not copy, distribute or modify content contained on this Website without prior written authorization from Capital Advisors Group. By viewing this Website and/or downloading its content, you agree to the Terms of Use & Privacy Policy.


