

February Month-End Portfolio Update
Another Record Month for the Corporate Bond Market
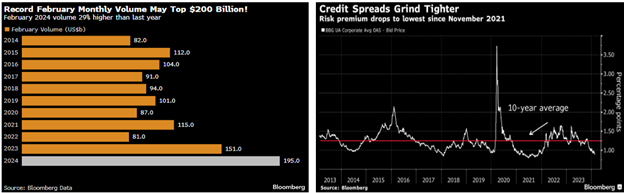
The investment-grade corporate bond market hit a record for new issuance for a second straight month in February. Blue-chip companies sold a February record of $195+ billion of bonds last month, topping the previous February 2023 record of $150.9 billion. Approximately $50 billion of bonds were sold last month to help finance acquisitions and spinoffs for AbbVie, Bristol Myers Squibb, and Cisco Systems. Bloomberg estimates that at least $276 billion of pending M&A activity stands to be financed in the investment grade market in 2024. Even the convertible bond market has seen an increase in issuance, with last week being the busiest in a year. The record issuance has been met with solid investor demand as money managers take advantage of higher yields in an environment with solid macroeconomic data and corporate earnings, all ahead of forecasted rate cuts from the Fed.
Source: Bloomberg
PCE vs. CPI
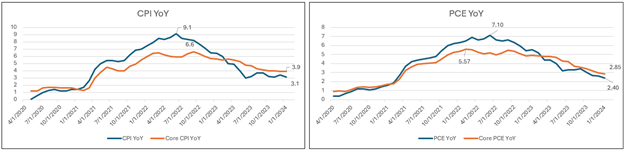
The Personal Consumption Expenditures (PCE) index was in line with expectations at +0.3% and +0.4% for headline and Core-PCE, respectively, in January. The year-over-year rates declined to 2.4% and 2.8%, respectively, marking the lowest readings since early 2021. Although the Core PCE monthly reading came in at the highest in a year, the year-over-year reading has seen 12 consecutive monthly declines, falling over 200 basis points to 2.8%.
PCE remains below CPI (Consumer Price Index) and although both indices measure inflation using a specific basket of goods and services consumed by households, there are differences between those baskets. Here are some of the key differences:
- Weights: The PCE index uses time-varying weights while CPI keeps weights fixed for a year. The PCE weights adjust to reflect changes in goods that consumers are actually buying. This is particularly notable when spending patterns change dramatically, such as at the start of the pandemic, when the CPI was still giving the same weights to cruise ship and airline fares, even though no one was traveling.
- Substitution Effects: Due to time-varying weights in the PCE, substitution behavior is more effectively recorded, as shoppers may swap higher priced items for lower priced items. CPI does not capture substitution behavior because the baskets are only updated once a year.
- Cost of Housing: Within CPI, housing comprises around 33% of the index, which is double that of the PCE index. If there are higher housing costs, CPI will rise more than PCE. Within the core readings, rents and owners equivalent rent account for a combined 43% in Core CPI while accounting for only 17% for Core PCE.
Source: Bloomberg
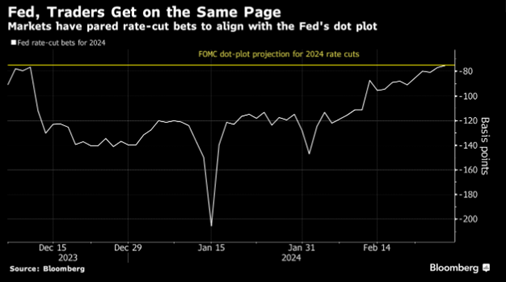
Market Expectations and Fed Guidance Converge
Market projections, as measured by fed funds futures, now match the Fed’s projections of 75 basis points of rate cuts in 2024. Not too long ago the market was pricing in over 150bps of cuts in 2024, with cuts starting at the March FOMC meeting, primarily due to expectations for lower inflation in 2024. However, with a continued solid labor market and consumer spending, economists are forecasting another year of positive GDP growth, albeit lower than the 2.5% growth in 2023, which could delay the start of rate cuts.
This information was prepared by Capital Advisors Group, Inc. from outside sources which we believe to be reliable. However, we make no representations as to its accuracy or completeness. The economic statistics presented in this report are subject to revision by the agencies that issue them.
Please click here for disclosure information: Our research is for personal, non-commercial use only. You may not copy, distribute or modify content contained on this Website without prior written authorization from Capital Advisors Group. By viewing this Website and/or downloading its content, you agree to the Terms of Use & Privacy Policy.