Optimizing Separate Account WAM in a Rising Rate Environment
Abstract
- For institutional cash investors unsure of separately managed accounts in a rising interest rate environment, our scenario analysis suggests that a laddered portfolio of agency and corporate securities with a modest WAM could outperform the government money market fund proxy with negligible unrealized loss concerns.
- Both agency and corporate portfolios with maximum maturities of up to 12 months may outperform government funds in up to four interest rate hikes in a 12-month period.
- Maximum expected unrealized losses are limited to 0.20% or less in worst-case scenarios. Moderate spread tightening in the latter part of a tightening cycle could dampen these “paper” losses.
Introduction
In the two years since the Federal Reserve started raising short-term interest rates, the psyche of the fixed income investor has been oscillating between loving higher rates and worrying about getting too much of them. With the changing of the guard at the Fed’s helm this year, the simmering anxiety about the downside of higher rates—namely unrealized losses—has given pause to some cash investors who otherwise may have wanted to take advantage of higher income potential.
As a manager of institutional separately managed accounts (SMAs), we often counsel investors on the impact of unrealized losses in a portfolio of cash equivalent and short-term securities in a rising rate environment. With the market consensus expecting more than three rate hikes after Fed Chairman Jerome Powell’s Congressional testimonies, we thought it appropriate to address this subject this month. Among related research commentaries we published over the last decade, we thought our March 2016 study on optimizing weighted average maturities (WAMs) would offer some helpful insight in today’s yield environment. We refreshed relevant yield curve data with rates as of February 28, 2018.
To address maximizing return potential and minimizing unrealized losses, we used a scenario analysis of several sample portfolios to show that, even in a rising interest rate environment, it may still pay to extend WAM in an SMA beyond that of typical government money market funds (“MMF”s).
Scenario Analysis Explained
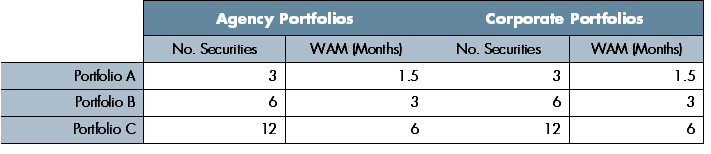
Six Portfolios: For our experiment, we designed two sets of sample portfolios with laddered maturities: one consisting of agency securities and the other of corporate credits rated Mid-A or higher. For each set, the 3-month portfolio contains three securities with one security maturing each month (months 1-3). The 6-month portfolio contains six securities with one security maturing each month (months 1-6).
Table 1: Sample Portfolios
Three Interest Rate Scenarios: With yield levels and spreads to the Federal Reserve’s reverse repurchase agreement (RRP) rate as of the test date, we designed the scenario analysis based on the assumption that the Federal Reserve will raise the overnight rate two to four times in the next 12 months. At each rate increase, all securities are immediately re-priced off of the new benchmark (RRP) rate, thus sustaining instantaneous unrealized losses as the result of the increase (See Table 2).
Table 2: Starting Portfolio Construct (Yield Spread as of February 28, 2018)
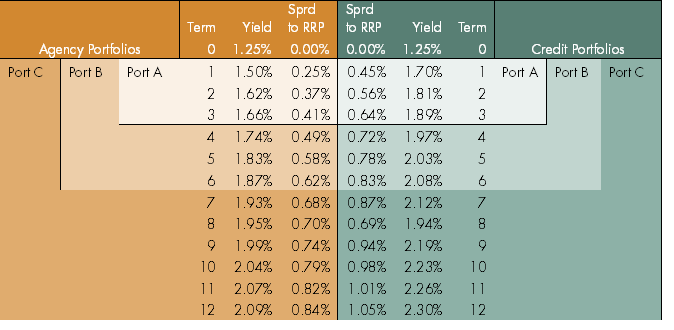
Source: Capital Advisors Group based on Bloomberg and broker pricing as of 2/28/2018. Rates vary greatly depending on instrument types and between specific counterparties. For illustrative purposes only.
Yield Spread Assumptions: We obtained fair value pricing for the respective securities with the assistance of our trading staff. The pricing date for our test data sets was February 28, 2018. We then converted those yield levels to spreads over the RRP rate, the lower bound of the fed funds rate (FFR) target range. For the first part of the test, we assumed that the spread relationship of all securities to the RRP would remain constant. For the second part of our original 2016 study, we increased the credit spreads of each security to the RRP at each rate hike to test the spread widening effect in a rising rate environment. We ran historical yield spread analysis on data from 2004 to May 2005, the first 12 months of the Federal Reserve’s previous interest rate tightening cycle. We observed that yield spreads grew wider to FFR only after the first increase. Subsequent rate increases resulted in moderate spread compression, meaning that yield on other instruments rose at a slower pace than the rate increase. For the 2018 update, we projected the credit spreads to tighten modestly resembling the 2004-2005 experience.
Objectives: The analysis has dual objectives – to compare the cumulative yield returns of the various model portfolios under different interest rate scenarios and their maximum potential unrealized losses over a 12-month period. The results would give insight to the appropriate WAM range given a certain path of the FFR. Since we assumed that we would hold all securities to maturity, principal fluctuations from market forces other than those resulting from rate increases were ignored. Also, since we assumed all securities were held to maturity, no actual losses were considered.
DOWNLOAD FULL REPORT
Our research is for personal, non-commercial use only. You may not copy, distribute or modify content contained on this Website without prior written authorization from Capital Advisors Group. By viewing this Website and/or downloading its content, you agree to the Terms of Use.
Please click here for disclosure information: Our research is for personal, non-commercial use only. You may not copy, distribute or modify content contained on this Website without prior written authorization from Capital Advisors Group. By viewing this Website and/or downloading its content, you agree to the Terms of Use & Privacy Policy.