
The $1.25 Trillion Credit Card Question: Do Rising Delinquencies Spell Trouble for Credit Card ABS Investors?
Key Takeaways
- Consumer credit headlines may not tell the full credit card ABS story. Broader consumer stress has been concentrated among lower-credit-quality borrowers, while major ABS trusts are primarily backed by seasoned, prime receivables.
- Structural features can be an important consideration. Payment rates, sellers’ interest, and excess spread are key factors investors evaluate when assessing credit card ABS performance.
- The labor market remains a key variable to monitor. Historically, unemployment trends have been closely tied to credit card performance.
- For cash investors, valuation matters alongside fundamentals. Market pricing, spreads, and underlying credit conditions all play a role in evaluating the asset class.
If you’ve read the headlines lately, you might think the American consumer is finally buckling.
In late May, The Wall Street Journal reported that the share of credit card balances at least 90 days past due climbed to 13.12% in the first quarter – the highest level since the aftermath of the 2008 financial crisis. Total credit card balances now stand at a record $1.25 trillion, while average credit card interest rates have jumped to 21%, up from 14.6% just four years ago.[1]
The latest New York Fed Survey of Consumer Expectations paints a similar picture. Households report their financial situations are the weakest since early 2023. Layoff expectations continue to rise, confidence in finding a new job has fallen to its lowest level since last December, and the perceived likelihood of missing a minimum debt payment ticked up to 12.6% in May.[2]
At first glance, these data points may seem concerning.
For treasury investors holding AAA-rated credit card asset-backed securities (ABS), the natural question is:
If the American consumer is buckling, should we be worried about the bonds backed by their credit card payments?
The honest answer is more nuanced than a simple yes or no. Understanding the current environment requires holding two seemingly contradictory facts in your head at once.
A Tale of Two Credit Markets: Why Consumer Credit Headlines May Not Tell the Whole Story
The first thing to understand is that the $1.25 trillion in outstanding credit card debt making headlines is not the same pool of receivables backing major credit card ABS trusts. Not even close.
The New York Fed’s Consumer Credit Panel captures the entire credit market, including prime, near-prime, and subprime borrowers across banks, retailers, and consumer finance companies. Within that broad universe, the deterioration is concentrated where one would expect.
Fed data show that household debt growth over the past two years has been driven primarily by subprime borrowers, in part reflecting negative migration from prime and near-prime score bands as delinquencies have risen.[3]
Bank-level data sharpen the picture at the lower end:
- Household cash cushions are shrinking. J.P. Morgan’s equity research team notes that median deposit balances now sit below 2019 levels after adjusting for the roughly 65% cumulative increase in essential living costs (compared with 30% for headline CPI)
- Household liquidity has weakened. The ratio of checking account balances to monthly spending, a rough gauge of the household cash cushion, has slipped beneath its pre-pandemic mark, with lower-income households bearing the most erosion.
- Buy now pay later (BNPL) usage has continued to grow. Since early 2023, gross merchandise value at Affirm has compounded at a 36% annual rate, while Klarna has grown at a 19% annual rate over the same stretch. This suggests that more consumers are financing everyday purchases. [4]
The collateral backing major bank credit card ABS looks very different.
The major bank card trusts are principally stocked with prime receivables from seasoned accounts. Their performance continues to reflect that higher credit quality.
In May 2026, 30+ day delinquencies across master trusts ranged from just 0.67% at American Express to 1.6% at Capital One, all down year over year. Annualized charge-offs across these trusts ranged between 1.24% and 2.28%, compared with the 4.17% charge-off rate at private-label lender Synchrony.
The takeaway is clear: the bifurcation of the American consumer is visible in the collateral itself.
Exhibit 1: Annualized Charge-Off Rates, Six Major Trusts vs. Private-Label Peers

Source: Trust disclosures as of 6/30/26. Major trusts: American Express Credit Account Master Trust, Chase Issuance Trust, Capital One Multi-Asset Execution Trust, Citibank Credit Card Issuance Trust, Discover Card Execution Note Trust, BA Master Credit Card Trust.
The Buffers Remain an Important Part of the Story
Across the six major trusts we track, the structural cushions that emerged from the post-crisis reform era remain in place. While broader consumer credit trends may need monitoring, these trusts are entering the current stress period from a position of strength rather than depletion.
Three factors, in particular, stand out:
1. Payment rate: Monthly principal collections across these pools remain well above pre-pandemic norms, reflecting a prime, transactor-heavy borrower base that continues to pay a large share of its outstanding balances each month.
Exhibit 2: The Annualized Principal Repayment Rate Remains Above Pre-Pandemic Levels

Source: Trust disclosures as of 6/30/26. Major trusts: American Express Credit Account Master Trust, Chase Issuance Trust, Capital One Multi-Asset Execution Trust, Citibank Credit Card Issuance Trust, Discover Card Execution Note Trust, BA Master Credit Card Trust
2. Sellers’ interest:[5] Sellers’ interest remains well above the 5% regulatory minimum across the major trusts we track, despite some normalization from pandemic-era highs.
Beyond satisfying risk-retention requirements, sellers’ interest serves as a first-loss buffer by absorbing non-cash reductions in receivables, known as dilutions – including returned goods, merchant disputes, and fraudulent charges – before they reach ABS investors.
By retaining substantially more exposure than required, sponsors have a strong financial incentive to manage the trusts conservatively.
Exhibit 3: Sellers’ Interest in Major Trusts, Current Levels vs. the 5% Regulatory Minimum

Source: Trust disclosures as of 6/30/26. Major trusts: American Express Credit Account Master Trust, Chase Issuance Trust, Capital One Multi-Asset Execution Trust, Citibank Credit Card Issuance Trust, Discover Card Execution Note Trust, BA Master Credit Card Trust
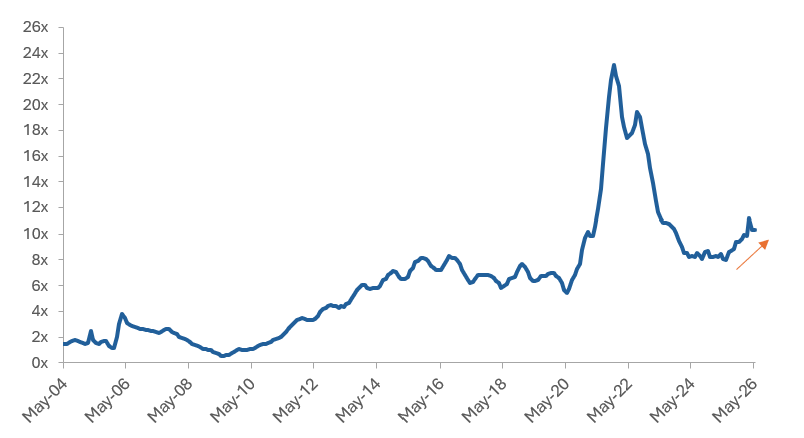
3. Excess spread coverage: We track express spread coverage – the ratio of excess spread to charge-offs – closely.
Excess spread represents the cash remaining after the trust pays noteholders, absorbs charge-offs, and covers expenses. Measuring it relative to charge-offs indicates how many times the trust’s cash cushion can cover the losses currently flowing through the portfolio.
By this measure, protection for senior noteholders remains well above historical averages. Excess spread coverage averaged roughly 8.0x charge-offs throughout 2024 and 2025 and has recently risen to around 10.0x.
For comparison, excess spread ranged between 2.0-3.0x before the 2008 financial crisis. This current level of excess spread represents a meaningful additional buffer against potential increases in credit losses.
Exhibit 4: Monthly Excess Spread Coverage in the Six Major Credit Card Trusts Remains Above Historical Averages
Source: Trust disclosures as of 6/30/26. Major trusts: American Express Credit Account Master Trust, Chase Issuance Trust, Capital One Multi-Asset Execution Trust, Citibank Credit Card Issuance Trust, Discover Card Execution Note Trust, BA Master Credit Card Trust
What Could Change the Outlook?
Historically, credit card ABS asset quality tends to move in tandem with unemployment, which is where our caution comes in.
The mechanism is straightforward: a cardholder who loses a paycheck may fall behind on credit card payments before other obligations, like a mortgage or auto loan, and those missed payments can eventually roll into charge-offs with a lag of roughly six months.
That relationship explains why trust charge-off rates have tracked the jobless rate through nearly every cycle on record, with COVID being the outlier. Structural protections provide important support, but they do not make the asset class immune to the effects of a genuine labor-market downturn[6].
For investors, the question is therefore not whether the buffers are adequate today, but what the labor market will look like tomorrow.
Exhibit 5: Unemployment Rate Moves in Tandem with ABS Charge-Offs

Source: BLS; trust disclosures as of 6/30/26.
The headline jobless rate remains relatively benign at 4.3%, but leading indicators appear less comforting.
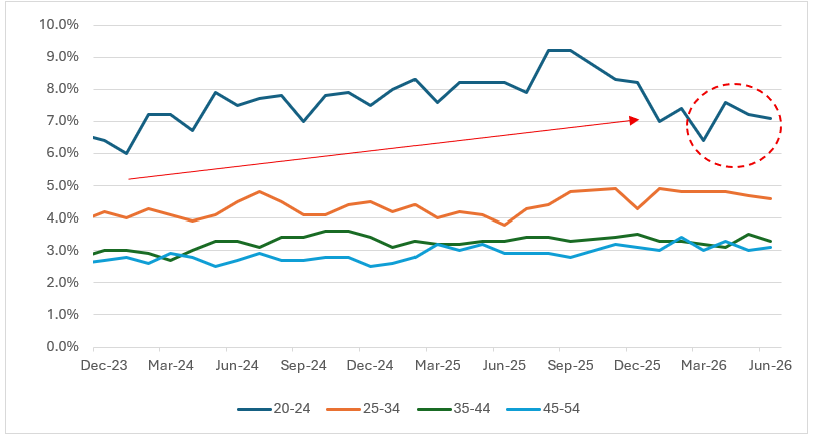
Unemployment among 20-24 year olds ticked back up to 7.6% in April 2026 and remained above 7% through June, even as the overall unemployment rate barely moved.
That cohort matters more than its size might suggest. Younger workers typically sit at the front end of the hiring cycle: employers often freeze entry-level recruiting long before they lay off tenured staff. Historically, a widening gap between youth and overall unemployment has been an early indicator of potential labor market softening.
The distinction matters for credit card ABS specifically, as younger borrowers are disproportionately the thin-file, lower-score accounts whose delinquencies move first when stress arrives.
As a result, industry-wide credit card data may show deterioration among younger, lower-credit-quality borrowers before broader trends emerge. However, seasoned prime credit card ABS trusts generally have limited direct exposure to these accounts.
Exhibit 6: Unemployment Rate Among Younger Americans Ticked Back Up in April But Below Prior Elevated Levels (Unemployment rate by age cohort, seasonally adjusted)
Source: Bureau of Labor Statistics and Federal Reserve Bank of St. Louis. Data through June 2026.
That gap could widen further as AI reshapes parts of the entry-level labor market.
According to J.P. Morgan, several occupations considered particularly exposed to AI, including customer service representatives and certain secretarial and sales roles, experienced relatively heavy job losses in 2025. Excluding medical secretaries, employment across 18 AI-exposed occupations identified by the BLS declined 1.6% between May 2024 and May 2025, while overall employment rose 0.8% over the same period.
Many of these occupations include entry-level and middle-income roles held disproportionately by younger workers. Unlike job losses tied to a conventional, rate-driven slowdown, positions displaced by AI may not return simply as monetary policy eases.
That may create a more persistent headwind for certain segments of the consumer market regardless of the Fed’s next policy move.
Exhibit 7: AI-Exposed Occupations Are Already Shrinking (Change in employment rate Year over Year)

Source: J.P. Morgan Markets
Monetary policy adds another complication.
Kevin Warsh, who took over as Fed chair in late May, delivered a decidedly hawkish message at his first FOMC meeting: “[t]he Committee will restore price stability.” The Committee held the federal funds rate at 3.5% to 3.75%, but nine of eighteen policymakers penciled in at least one hike before year-end.
A renewed hiking bias cuts both ways for credit card ABS.
For cardholders, higher policy rates push already-elevated borrowing costs. Most credit card rates are variable and adjust quickly with the prime rate, meaning rate increases can directly fall on the households identified by the New York Fed’s survey as most vulnerable. Over time, this could intensify minimum-payment stress and potentially add to delinquencies and charge-offs at the margin.
For trust investors, however, the impact is more balanced.
Higher credit card rates increase receivable yields, which can support excess spread and strengthen the trusts’ first line of defense even as borrower credit quality weakens. At the same time, Warsh’s move away from explicit forward guidance could make rate expectations, and the front end of the yield curve, more volatile than cash investors have grown accustomed to.
The practical takeaway: a higher-for-longer rate environment, once viewed as a tail risk, is becoming a more important scenario for investors to consider.
That outcome could create opposing forces: increased pressure on consumers while simultaneously supporting trust-level excess spread, making the relationship between underlying credit performance and structural protection more nuanced.
Is the Market Pricing These Risks?
Exhibit 8: US ABS Supply by Sector ($ billions)

Source: J.P. Morgan Markets, ABS Weekly Volume Datasheet, as of 6/30/2026.
Not much.
The credit card ABS market itself shows little sign of stress. New issuance is running at a record pace, with $201 billion issued year-to-date through the end of June, ahead of last year’s $171.5 billion.
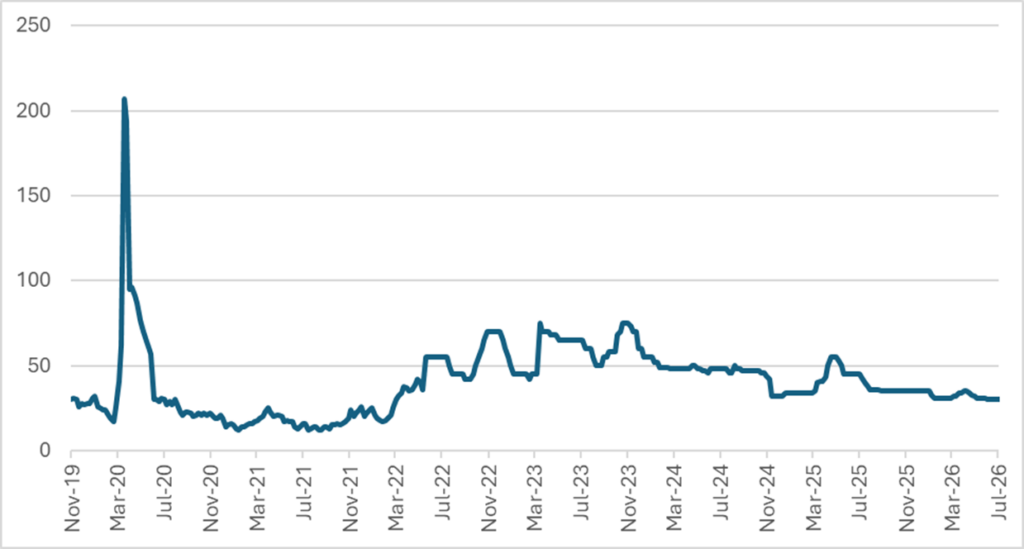
Investor demand remains robust. Benchmark AAA credit card ABS spreads tightened by one basis point in early June, and spreads of roughly 29-37 basis points over Treasuries across the curve sit only marginally above year-end 2019 levels[7].
That comparison is worth pondering.
The spread represents the additional compensation investors earn for holding consumer credit risk instead of Treasuries – it is effectively the market’s price of fear.
At the end of 2019, the consumer backdrop was in the best shape in recent memory, with unemployment at 3.5% and credit card delinquencies near cycle lows. Today, investors are earning only modestly more than they were then, despite the headline 90-day delinquencies reaching the highest levels in 15 years and signs of a softer labor market.
Exhibit 9: 3-Year AAA Credit Card ABS Spread to Treasuries (Bp)
Source: J.P. Morgan Markets, Credit Card ABS Monthly, as of 6/30/2026.
However, for cash portfolios, the exposure that tight spreads may fail to compensate for is mark-to-market and liquidity risk: the potential impact of selling before maturity or carrying unrealized losses if spreads widen.
The market’s firmness therefore cuts two ways.
On one hand, strong market demand reflects continued institutional confidence in the asset class. On the other, it means investors are receiving compensation closer to pre-pandemic levels for holding consumer credit risk in a decidedly different post-pandemic environment.
Ultimately, it’s valuation, rather than fundamentals, that generally keeps our enthusiasm in check.
The Bottom Line: Constructive, Not Complacent
The scariest consumer credit headlines in 15 years and the calmest trust data in recent months may both be true at the same time because they describe different borrowers.
For now, the fundamentals backing major credit card ABS trusts appear to be solid. The collateral quality, structural protections, and transparency that have long distinguished this corner of the market remain evident.
But constructive is not the same as complacent.
The divergence between prime trust performance and the broader consumer cannot widen indefinitely. Either the labor market holds and the gap persists, or a meaningful rise in unemployment eventually flows through to trust performance.
Until that question is resolved, we favor strong sponsors and a surveillance cadence that places significant emphasis on monthly trust disclosures.
The doors to this asset class remain open. We simply suggest checking the weather before walking through.
Appendix: Key Credit Card ABS Terminology
Asset-backed securities (ABS) — Bonds whose interest and principal payments come from the cash flows of a dedicated pool of financial assets—here, credit card receivables—rather than from the general revenues of a company. The assets are legally isolated in a trust, so the bonds’ credit quality depends on the pool and the deal’s structure, not on the sponsoring bank’s balance sheet.
Receivables — The amounts cardholders owe on their credit card accounts—the outstanding balances plus the interest and fees they generate. These are the assets inside the trust; cardholders’ monthly payments are the cash that services the bonds.
Master trust — The legal entity that holds a large, ongoing pool of credit card receivables and issues multiple series of bonds against it over time. Unlike a deal backed by a fixed pool of loans, a master trust continuously receives new receivables as cardholders spend and repay, which is why the same six major trusts can be tracked month after month.
Sponsor — The bank or finance company that originates the card accounts, sells the receivables into the trust, and typically services them (collects payments, manages delinquent accounts). American Express, Chase, and Citibank are sponsors of the trusts discussed in this piece.
Noteholders / senior noteholders — The investors who own the bonds that a trust issues. Bonds are issued in ranked classes: senior (typically AAA-rated) classes are paid first and absorb losses last, while subordinate classes stand behind them. Cash portfolios generally hold only the senior classes.
Delinquency rate — The share of receivables on which cardholders have missed payments, grouped by how far behind they are (e.g., 30+ or 90+ days past due). Delinquencies are the early-warning stage: balances that stay delinquent long enough are eventually written off.
Charge-off (net charge-off rate) — The share of receivables the trust writes off as uncollectible, usually after about 180 days of nonpayment, net of any amounts later recovered. Expressed as an annualized percentage of the pool, it is the most direct measure of realized credit losses.
Payment rate (principal payment rate) — The percentage of the pool’s outstanding balance that cardholders pay down each month. A high payment rate signals a borrower base dominated by “transactors” (people who pay their bills in full) and means the trust could return investors’ principal quickly if a deal were ever wound down early.
Excess spread — The trust’s monthly cash surplus: the yield collected from cardholders (interest and fees) minus the interest owed to noteholders, servicing costs, and charge-offs. It is the first buffer against losses; losses must burn through excess spread before any bondholder is affected.
Sellers’ interest (seller’s percentage) — The sponsor’s own retained share of the trust’s receivables—the portion of the pool that is not funding investors’ bonds. By market convention it is quoted relative to the bonds outstanding, not the total pool: sellers’ interest = (total principal receivables in the trust − investor interest, i.e., notes outstanding) ÷ notes outstanding. Nowadays, banks have shifted card funding toward deposits and issue fewer bonds, so trust pools have grown to a multiple of the securities they back resulting in a high reading; the ratio also swings with seasonal card balances and as maturing notes roll off without replacement. Post-crisis risk-retention rules (Regulation RR) set the floor at 5%. The sellers’ interest ranks pari passu with investors. Its role is to absorb fluctuations in pool size and dilution (merchandise returns, disputed charges) and, above all, to align sponsor’s incentives with bondholders’.
Private-label cards — Store-branded credit cards (usable only at a particular retailer) issued by specialist lenders such as Synchrony and Bread Financial. Their borrower base skews lower-score than general-purpose bank cards, which is why their loss rates run well above those of the six major trusts.
[1] WSJ – Americans Are Falling Behind on Their $1.25 Trillion Credit-Card Bill
[2] Federal Reserve Bank of New York – Household Financial Outlook Deteriorates; Short-Term Inflation Expectations Decline
[3] Ibid.
[4] J.P. Morgan Markets – Large Banks Consumer Credit
[5] In credit card ABS, the “seller’s interest” represents the sponsor’s retained ownership in the trust’s unsecuritized receivables, ensuring they maintain “skin in the game” under Dodd-Frank risk retention rules.
[6] Government support and high savings rates kept charge-offs low at the start of the pandemic. Ballooned household wealth, and the still tight labor market has kept charge-offs low despite persistently high inflation weighing on household finances.
[7] JPMorgan Research: ABS Weekly Spreads as of 6/30/2026
Please click here for disclosure information: Our research is for personal, non-commercial use only. You may not copy, distribute or modify content contained on this Website without prior written authorization from Capital Advisors Group. By viewing this Website and/or downloading its content, you agree to the Terms of Use & Privacy Policy.