A2/P2 (Tier-2) Commercial Paper: Considerations for Institutional Cash Investors
As money market reform reshapes institutional cash investing, treasury teams may find it worthwhile to take a closer look at A2/P2 commercial paper—and its potential impact on portfolio yield and liquidity.
Key Takeaways:
- Tier-2 Commercial Paper (CP) is still prime—short-term, investment-grade, one notch below Tier-1.
- Market structure has changed—money market fund reforms and Tier-2’s growing share of CP may encourage a reassessment of cash strategies.
- Tier-2 has historically offered higher yields—typically trading at a yield premium over Tier-1 and common liquidity benchmarks.
- Implementation generally requires expertise—effective use depends on strong credit surveillance, issuer monitoring, diversification, and disciplined portfolio construction.
For corporate treasury teams managing large liquidity portfolios, the past several years have forced a reconsideration of familiar cash investment strategies. After the Federal Reserve began easing interest rates following the largest tightening cycle in decades, treasury organizations have been searching for ways to preserve income without taking on unacceptable risk or sacrificing liquidity.
The Case for A2/P2 Commercial Paper (Tier-2 CP)
One less-explored strategy for cash investors may be the inclusion of A2/P2 commercial paper (CP), commonly known as Tier-2 CP. When managed properly, Tier-2 CP may help to:
- Improve income potential
- Diversify credit risk
Historically, treasury teams avoided lower-rated Tier-2 commercial paper (CP), preferring the simplicity and perceived safety of Tier-1 issuers—typically through buying prime money market funds.
But that has since shifted. Several rounds of money market fund reform have reduced the relative attractiveness of institutional prime funds, with:
- Mandatory liquidity fees under certain market conditions
- Tighter liquidity requirements
Meanwhile, Tier-2 paper has become a huge part of the commercial paper market. As a result, some institutional investors are taking a fresh look at direct investments in commercial paper—including Tier-2 CP.
While Tier-2 commercial paper may offer attractive yield enhancement potential, it also carries greater credit and liquidity risks compared to other fixed income cash securities. Mitigating these risks requires a comprehensive understanding of:
- Risk tolerance
- Credit quality
- Portfolio liquidity objectives
Balancing these factors is critical when pursuing optimal risk-adjusted performance objectives, and the complexity may be best navigated by experienced institutional cash managers with deep credit research expertise who can evaluate return opportunities while seeking to manage risk and preserve capital.
What is A2/P2 Commercial Paper?
A2/P2 commercial paper (Tier-2 CP) refers to short-term, unsecured promissory notes carrying one of the following short-term credit ratings:
- P-2 from Moody’s
- A-2 from S&P
- F2 from Fitch
While these ratings are lower than “Tier-1,” A2/P2 CP is still considered “prime” or “investment-grade”, typically linked to long-term credit ratings from the lower end of the single-A range through mid-BBB categories.
Tier-2 CP plays an important role of short-term funding markets, offering institutional investors an alternative to:
- U.S. Treasury securities (T-bills)
- Certificates of deposit (CDs)
- Money market funds
The Evolution of the A2/P2 Commercial Paper Market
The U.S. commercial paper (CP) market reached its peak in 2007 at roughly $2.0 trillion in total outstandings—more than half of which was asset-backed commercial paper (ABCP).
Then came the Global Financial Crisis (GFC). As funding markets seized, ratings deteriorated, and investor confidence collapsed, CP issuance and demand contracted by as much as 51%.
The market has since recovered, with CP outstanding climbing steadily from its 2017 low to reach $1.3 trillion by the end of 2025—though it remains roughly 33% below pre-crisis levels. (see Figure 1)
Figure 1: Total Commercial Paper Outstanding (in $ billions)
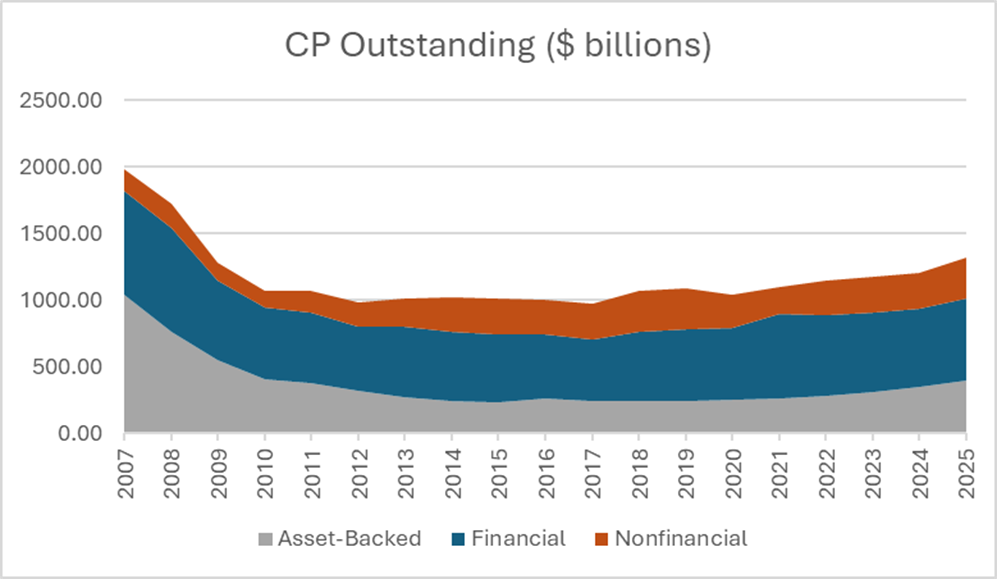
Source: Federal Reserve
Since 2007, Tier-2 CP has grown in total volume, even as ABCP and Tier-1 CP balances have declined:
- 2007: ~$72 billion outstanding
- 2025: ~$116 billion outstanding
Even as the broader commercial paper market contracted, Tier-2 CP’s share of total outstandings steadily expanded—from just 3.6% in 2007 to nearly 9% in 2025 (see Figure 2). That shift underscores Tier-2’s evolution from a niche allocation into a mainstream liquidity instrument for institutional cash investors.
Figure 2: Total Tier 1 and Tier 2 Commercial Paper Outstanding (in $ billion)

Source: Federal Reserve
Boosting Cash Portfolio Yields with A2/P2 Commercial Paper
For investors who can tolerate the incremental credit and liquidity risks of Tier-2 commercial paper (CP), the tradeoff may be higher return potential relative to lower-risk cash equivalents.
Empirical data supports this notion. Looking at non-financial commercial paper rates since 1998, the average quarterly yield spread between 90-day Tier-2 non-financial CP and Tier-1 non-financial CP has been approximately 35 basis points (0.35%).
What does this mean in portfolio terms? Consider an example of a $100 million allocation held over five years:
- 35 bps spread maintained
- ~ $1.8 million in additional income generated over the period
This example is hypothetical and for illustrative purposes only. Actual yields, spreads, and investment results will vary.
For corporate treasurers and institutional cash managers, that extra income may be meaningful, particularly in low-spread environments where every incremental basis point can contribute to portfolio performance.
Figure 3: Yield Spread of 90-Day Tier 2 Non-financial to 90-day Tier 1 Non-financial

Source: Federal Reserve Observed Commercial Paper Rates
Historically, Tier-2 commercial paper has delivered materially wide spreads across 7-day, 1-month, and 3-month maturities—relative to both Tier-1 paper and common liquidity benchmarks.
Figure 4: Average Yield Spread over Benchmarks*
| Average 2009-2025 | |||
| 7-Day | 1-Month | 3-Month | |
| vs. FFR | vs. Govt MMF | vs. 3-month Treasury | |
| Tier 1 Non-Fin | 0.08% | 0.19% | 0.08% |
| Tier 1 Fin | 0.10% | 0.19% | 0.13% |
| Tier 2 | 0.30% | 0.45% | 0.38% |
Sources: Federal Reserve Observed Commercial Paper Rates, Crane Data, Bloomberg
Based on average returns since 2009, Tier-1 CP has generally delivered a high-single-digit to low-double-digit (bps) yield advantage over its benchmarks. Tier-2 CP, by contrast, has delivered significantly more.
How Ratings Migration Risk Impacts A2/P2 Commercial Paper
Data indicates that downward ratings migration risk for Tier-2 commercial paper (CP) is incrementally higher than Tier-1 paper, but still low on an absolute basis.
According to a Moody’s study on commercial paper issuers from 1972-2024, the probability of default for outstanding Tier-2 CP over a one-year period is less than 0.04%—only about 1 bp higher than Tier-1 paper.[1]
A closer look at the migration data reveals a more nuanced picture:
- Short-term downgrades: The probability of a one-notch downgrade beyond 90 days is lower for P-2 rated CP than for P-1 rated CP
- Longer-horizon risk: The likelihood of being downgraded to nonprime status is higher for P-2 CP, and that risk grows with the investment horizon
The study indicates that the key concern with A2/P2 CP is not just downgrade noise, but the risk of “falling out” of prime eligibility altogether.
For institutional investors, that scenario may lead to one of the following depending on an investor’s internal guidelines:
- Internal policy violations
- Forced selling
This reinforces the need for ongoing credit surveillance, issuer monitoring, and portfolio diversification to manage exposure and maintain principal stability within institutional cash portfolios.
Figure 5: Average probability of a CP downgrade, 1972-2024
| Investment Horizon (Days) | Moody’s Short-term rating | One-notch downgrade probability | Probability of downgrade to NP |
| 30 | P-1 | 0.35% | 0.01% |
| P-2 | 0.37% | 0.08% | |
| 90 | P-1 | 1.04% | 0.02% |
| P-2 | 0.99% | 0.28% | |
| 180 | P-1 | 2.00% | 0.06% |
| P-2 | 1.73% | 0.61% | |
| 270 | P-1 | 2.90% | 0.11% |
| P-2 | 2.30% | 0.93% | |
| 365 | P-1 | 3.73% | 0.16% |
| P-2 | 2.74% | 1.24% |
Source: Moody’s Ratings
Figure 6: Historical Average Default Rates, 1972-2024*

*Figures represent Moody’s-adjusted default rates, which exclude defaults of issuers who had no outstanding CP
Source: Moody’s Ratings
Not All Tier-2 Issuers Are the Same
Tier-2 issuers typically exhibit greater diversity in both scope and credit quality than their higher-rated peers.
Sector Composition: Tier-1 vs. Tier-2
- Tier-1 paper offerings tend to skew towards financial issuers reliant on market funding
- Tier-2 issuance tends to skew towards capital-intensive industries
Depending on regulatory frameworks, interest rate environments, and issuer balance sheet policies, Tier-2’s sector tilt may be either a source of risk or a source of stability.
At the same time, credit risk may vary considerably even among similarly rated credits. This distinction is particularly apparent between financial and nonfinancial issuers.
To better protect against credit migration and liquidity risk, investors should conduct credit research focused on:
- Company fundamentals
- Sector trends
- Macroeconomic environments
The goal: identify issuers that are “Tier-2 by rating, Tier-1 by quality.”
Financials vs. Non-Financials
Financial companies, such as banks and insurance firms, tend to be:
- Highly leveraged and deeply interconnected with capital markets
- Sensitive to interest rate fluctuations, credit cycles, and investor confidence
- Vulnerable to contagion risk during periods of systemic stress, when a loss of confidence in one institution can quickly cast doubt on the stability of the entire sector
Non-financial CP issued by industrial firms, retailers, and service-oriented companies, typically:
- Carries lower exposure to “blow up” risks that can rapidly erode a financial institution’s funding base
- Sees credit profiles evolve more gradually, making event-driven risks somewhat more foreseeable and manageable
- Remains exposed to economic downturns
The takeaway: credit quality trade-down from Tier-1 to Tier-2 financial issuers can be materially different from non-financial issuers.
Protecting Your Portfolio from A2/P2 CP Event-Driven Risks
Beyond ratings migration, commercial paper investors also face event-driven risk. Mergers and acquisitions (M&As) and leveraged buyouts (LBOs) can rapidly and significantly transform an issuer’s credit quality.
These events often unfold faster than rating agencies can react, meaning credit ratings may not fully reflect heightened risk until a transaction is announced or completed.
Why Tier-2 Issuers Are Often Targets
Lower-rated companies are often attractive as LBO targets because of perceived upside from:
- Operational improvements
- Cost synergies
- Balance sheet leverage to enhance returns
M&A vs. LBO
M&A is a standard component of corporate strategy and can be credit-positive when it enhances scale, diversification, and long-term earnings power.
That said, M&A is not without risk for creditors. Combining two organizations introduces integration challenges—merging distinct corporate cultures, operational systems, and product lines—and missteps can lead to weaker-than-expected financial performance. If a deal is perceived to materially weaken the firm’s financial profile or increase its business risk, it may result in a credit rating downgrade.
LBOs, however, are a different story. Typically pursued by an activist investor or the management team to enhance short-term shareholder returns, LBOs scale up the business using money borrowed against the company’s existing assets. That introduces real risk for creditors:
- Substantial new debt issuance can weaken the balance sheet
- Key credit metrics may come under strain
For CP investors, the announcement of an M&A or LBO might serve as a trigger to take action —before credit ratings and yield spreads fully reflect the transaction’s impact:
- Reassess the issuer’s suitability
- Re-evaluate exposure size and tenor
- Determine whether to reduce or exit positions
Treasurers should consider whether they possess the in-house capabilities to navigate this complexity, or whether they should consult outside investment professionals.
Conclusion: Strategies for A2/P2 Commercial Paper Investors
For investors with relatively low near-term liquidity needs, it may be worth assessing whether Tier-2 commercial paper (A2/P2 CP) fits within their overall cash management strategy. Historically, Tier-2 commercial paper provided double-digit basis-point spreads, on average, over Tier-1 CP of comparable maturities—a gain in incremental yields.
Of course, those yield benefits come with added responsibility.
Including Tier-2 paper in a cash portfolio requires:
- Stronger credit surveillance
- Deeper issuer analysis
- More disciplined portfolio construction
Investors familiar with the characteristics of these risks can manage their portfolios with a more conservative credit approach.
The bottom line: Supplementing an existing liquidity portfolio with Tier-2 CP may provide an opportunity for investors to enhance yield potential over time while maintaining a focus on the principal preservation and liquidity objectives that define a well-managed cash portfolio.
* Due to calendar effects, yield data as of quarter- and year-ends may not be fully representative of the market on normal days. On these dates, borrowers’ funding needs may differ with an eye towards regulatory liquidity requirements and balance sheet appearance. Some data distortion is unavoidable and difficult to correct.
[1] Default rates and loss severity in both Tier-1 and Tier-2 CP markets may be distorted by the “orderly exit” effect. Issuers experiencing credit deterioration often lose market access and stop issuing commercial paper before an actual default occurs. This can make historical default and loss data appear more favorable than it would if weaker issuers had remained active..
Please click here for disclosure information: Our research is for personal, non-commercial use only. You may not copy, distribute or modify content contained on this Website without prior written authorization from Capital Advisors Group. By viewing this Website and/or downloading its content, you agree to the Terms of Use & Privacy Policy.